*
[Note: The Java Applet for this animation can no longer be run in a web browser. Clicking this link, however, will download to your computer a Java Web Start file named TaperedPipeLaunch.jnlp. This file can launch the animation in a separate window on your computer. Downloading and executing the file may be blocked by local Java permissions, but persevere! You may finally have to launch the file by right-clicking (control-clicking) it and choosing Open, instead of simply double-clicking it.]
*
Like the cylindrical pipes applet, this purports to show the first three normal modes of standing waves of sound waves in a pipe open at both ends. However, in this case the pipe may be varied continuously from cylindrical, open at both ends, to conical. In the intermediate stages, the pipe is still open at both ends, but the two ends of the pipe have different radii. Of interest is to observe how the standing wave patterns change as the pipe is transformed from a cylinder to a cone. In this applet, as discussed below, the diagram of motions of planes of molecules in the pipe is less informative than the graphs of the pressure and displacement of air in the pipe.
1. At the bottom of the window is a button labeled “Go/Stop.” Clicking the button at any time stops or restarts the motion.
Also at the bottom of the window is a slider that may be used to change the radius of the left end of the pipe from full size to zero.
2. At the top of the window is a menu bar that controls the display. Available menu choices and their effects are the following:
| Menu Selection | Action |
|---|---|
| Taper > About Taper | Reveals the name of the author and the year the applet was written. |
| Mode > Mode 1 | The lowest frequency normal mode motion of air in the pipe. On the diagram the frequency of this mode is given in terms of v, the speed of sound in air, and L, the ideal length of the pipe. |
| Mode > Mode 2 | The second-lowest frequency normal mode motion of air in the pipe. The frequency of this mode, relative to that of the first mode, is shown on the diagram. |
| Mode > Mode 3 | The third-lowest frequency normal mode motion of air in the pipe. The frequency of this mode, relative to that of the first mode, is shown on the diagram. |
| Graph > Pressure | Selecting this turns on or off a dynamic graph of the deviation of the pressure from equilibrium at each point in the pipe at each instant. This and the displacement graph may be displayed simultaneously. |
| Graph > Displacement | Toggles a dynamic graph of the displacement of air molecules from their undisturbed positions in the pipe at each instant. This and the pressure graph may be displayed simultaneously. |
1. Turn on the Pressure graph, display the second or third mode, and perhaps stop the animation when the excess pressure pattern is of maximum amplitude. Study how the pressure distribution changes as the pipe is changed from cylindrical to conical. You will note that the pressure nodes remain fixed in position throughout this process while the left-most antinode moves to the left to eventually become an antinode at the tip of the cone when the pipe is closed.
2. Examine the Displacement graph by itself in the same way. You will see that the left-most displacement node moves to the left when the pipe is narrowed, until it is a node at the tip of a cone. You will also see that when the left end is not quite closed the displacement of air molecules at the left end is many times greater than the displacement anywhere else in the pipe.
3. Turn on the Pressure and Displacement graphs together. When opening at the left end of the pipe gets small the displacement nodes still coincide with the pressure antinodes. That is, the pressure antinodes are still centered at points where air molecules are approaching from both directions.
However, the displacement antinodes do not occur at the same points as the pressure nodes. At a displacement antinode, where the tangent to the displacement graph is horizontal, the molecules in a small horizontal region all have the same displacement. In a cylinder this does not lead to a change in pressure. But in a tapered pipe this moves the molecules to a different size pipe and this compresses or expands the gas and results in a pressure change.
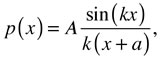
Once the pipe becomes non-cylindrical, the wave equation is solved in spherical coordinates with the origin at the cone apex to which the taper projects (See Ayers, Eliason, and Mahgerefteh, Am. J. Phys 53, 528-537 (June 1985)). The wavefronts are spherical, a detail not represented in the applet. The solution for the space part of the standing waves of pressure are of the form
where x is measured along the axis of the pipe starting at the narrow end, and a is the distance from the narrow end back to the origin of the spherical coordinates. The cone limit is achieved by letting a become 0.
Boundary conditions of zero pressure at each end of the tapered pipe determine the permissible values of k, and hence the standing wave frequencies. The zeros of the pressure function are contained in the sine function, just as in a cylindrical pipe. Hence the standing wave frequencies are the same as for a same-length cylindrical pipe open at both ends, and the pressure nodes are at the same positions in the pipe.
There are at least two reasons that the green lines in the pipe diagram are not a good representation of the motion of air molecules. First, the various antinodes of displacement are so different in amplitude that it is difficult to represent the whole situation in the diagram. If the motion near the narrow end is clearly shown, then the lines near the wide end may have negligible motion. More significantly, the lines are computed based simply on calculated displacements of air molecules. The lines are close together where two horizontally-nearby molecules have quite different displacements. Therefore the spacing of the lines is not a complete indication of the pressure because it does not take into account the effect of the changing diameter of the pipe. The behavior of these lines should not be used to draw detailed conclusions about motion of air in the pipe.