Mechanics >
Kinematics > Motion in One-Dimension >
Measurement of g
DCS# 1C30.xx
FREE FALL
MOTION GRAPHS WITH SONIC RANGER
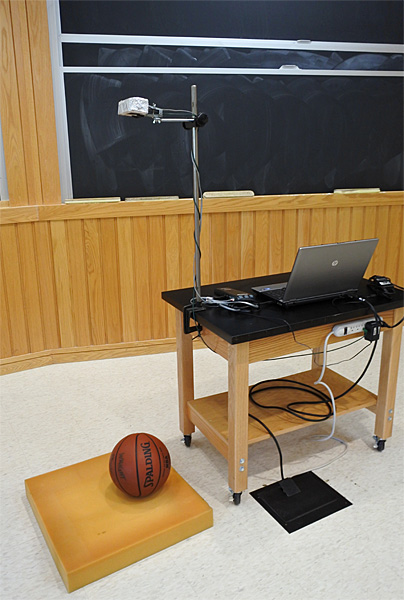
APPARATUS
rubber ball
107-02-E5
motion sensor
101-05-B1
laptop
206
LabPro interface
107-02-B3
clamp
202-01-E1
DESCRIPTION
Use the motion sensor to
monitor a bouncing ball and plot position, velocity and
acceleration vs time.
The value of the acceleration
due to gravity is best obtained by fitting a regression line
to a portion of the velocity graph.
NOTES
To just determine g, drop the
ball onto a cushion (202-01-A) to minimize artifacts
in the data from echos off hard surfaces.
Keep stray objects, in particular the sensor cable, out of the
30° cone of the sensor. The sensor cannot detect the
ball when it is closer than 0.4 m.
It may take several trials to
get one run in which the ball remains in the sensor's field of
view.
The experiment file entitled
"sports.mbl" has the x, v, and a vs t graphs displayed with
appropriately scaled axes. Zero the sensor with the ball
on the floor. Alternatively, go to setup >
sensors > details to set up graphs so that the origin
is at the floor and displacements toward the sensor are
positive.