| Modern Physics > Nuclear Physics > Radioactive Decay | DCS# 7D30.08 |
| laptop with LabPro/LoggerPro interface | 206 |
| modified counter | 214-02-B |
| geiger tube | 214-02-B |
| wooden
holder for tube and source |
214-02-B |
| long half-life source | 015A-lead cabinet |
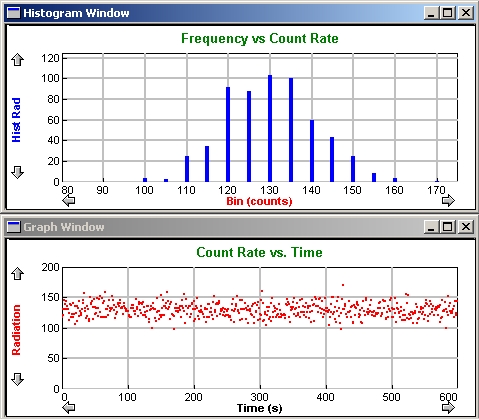
Use "counting histogram" experiment file.
Have the counter set to the appropriate operating voltage for the geiger tube.
Use a sufficiently active source - the calibration source from the old survey meter works well.
Make sure the axes and bins are scaled appropriately.