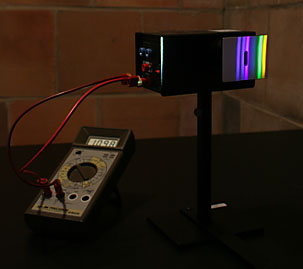
| Modern Physics > Quantum Effects > Photoelectric Effect | DCS# 7A10.30 |
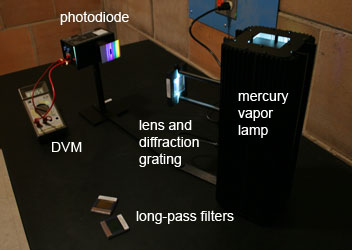
| pasco photodiode circuit box | 214-03-A |
| mercury lamp | 214-03-A |
| filter set | 214-03-A |
| neutral density filter | 214-03-A |
| digital multimeter | 214-02-B6 |
| laptop | 206 |
 The frequencies
of the visible lines in the mercury spectrum are:
The frequencies
of the visible lines in the mercury spectrum are: | yellow |
5.187 x 10¹⁴ Hz |
| green |
5.490 x 10¹⁴ Hz |
| blue |
6.879 x 10¹⁴ Hz |
| violet |
7.409 x 10¹⁴ Hz |
| ultraviolet |
8.202 x 10¹⁴ Hz |