| Modern Physics > Nuclear Physics > Radioactive Decay | DCS# 7D10.25 |

| modified counter and geiger-muller tube | 214-02-B |
| vernier interface | 113 |
| 1/4" stereo - BNC cable | 101-13-C |
| laptop | 206 |
| balloon | 202-14-E4 |
| rabbit fur | 202-18-D5 |
| rubber band | 111 |
| paper clamp | 111 |
| masking
tape |
111 |

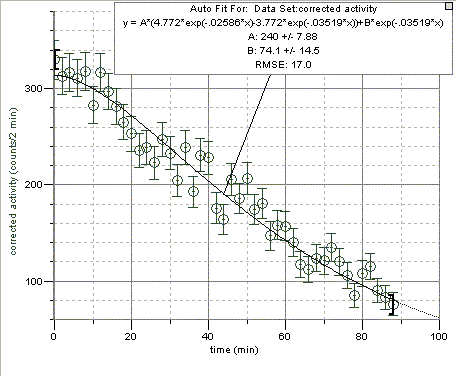
Blow up, clamp, and charge the balloon 60 minutes before counting is to start. Leave it in the machine shop until it is needed.REFERENCESThe experiment file is set up to do two-minute counts for 120 minutes. The "corrected counts" column = counts/min - background counts/minute, where background was measured to be 20 +/- 1 in room 201.
The modified counter outputs a 0-5 VDC TTL pulse with each event.
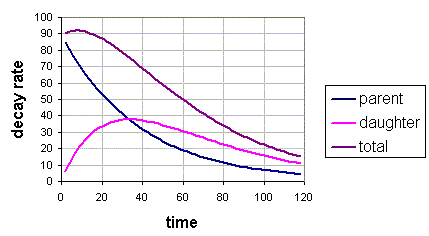
See the decay series of radon for the half-lives of the radon progeny.
AJP 30, 120 (1962).