Where Was Bean Town?
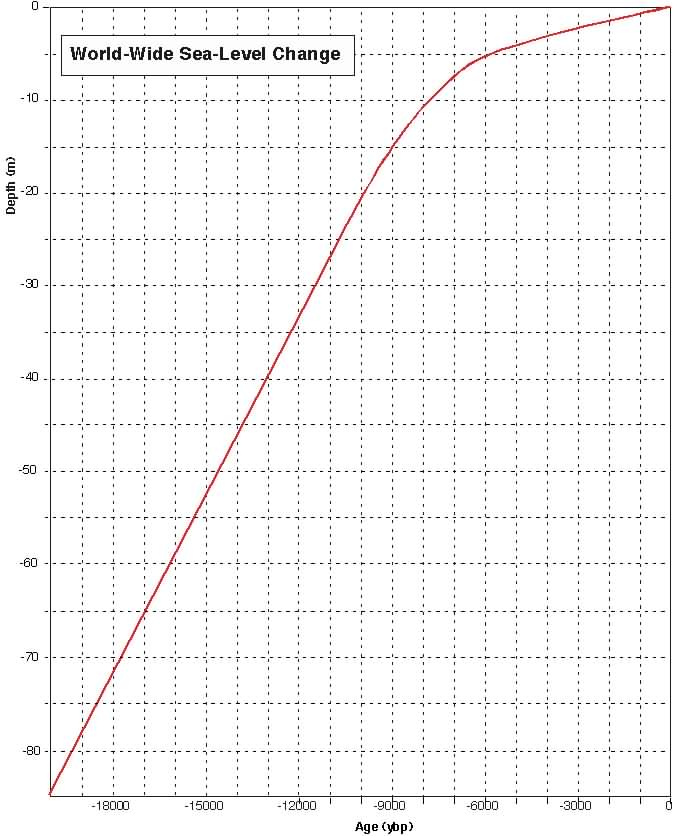
The graph to the left below summarizes the change in glacio-eustatic sea level (i.e., the world-wide average caused by glacial melting) over the past 20,000 years. For class on Friday, use this plus the empty graph that I have provided to show where Boston was (vertically) relative to world-wide sea level for the past 20,000 years. Think about what's going to happen to Boston during full glaciation and the ensuing de-glaciation. It will not stay in the same absolute position where it is today (approximately at sea level = 0). You will need to think about where sea level was for a particular thoudsand-year period (I've given you this) and how Boston's absolute vertical position (i.e., relative to today) might have been different at the same time. The difference will give you a number of how far above or below sea level Boston was AT THAT TIME.
I'd make this more formulaic, but you Obies always complain so much when we give you simple and repetitive computations to do, so here's some critical thinking - love it!! But, I will give you as little help. First, plot where you think Boston was at various times in the past using the "World-Wide Sea-Level Change" graph. Was it higher or lower at times in the past than it is today - and, if so, by how much? (note: you can't get an exact number here, but you should be able to show a general sense of if Boston changed absolute elevation, and if so, in what direction). For example, today Boston will be at zero meters and the relative water depth will be 0. It's present depth is 0... duh! If it was 10 meters lower 1000 years ago, then it would have been about 9 meters underwater based on the sea-level curve I have provided for you (this is just an example and not necessarily correct). Repeat this back through time (you probably don't have to do it for every 1,000 year slice - look at where the glaciers were in the posted lecture slides).