Wave Exercise
For Monday, go to the following web site, which can alse be reached through the e-syllabus.
http://www.coastal.udel.edu/faculty/rad/wavetheory.html
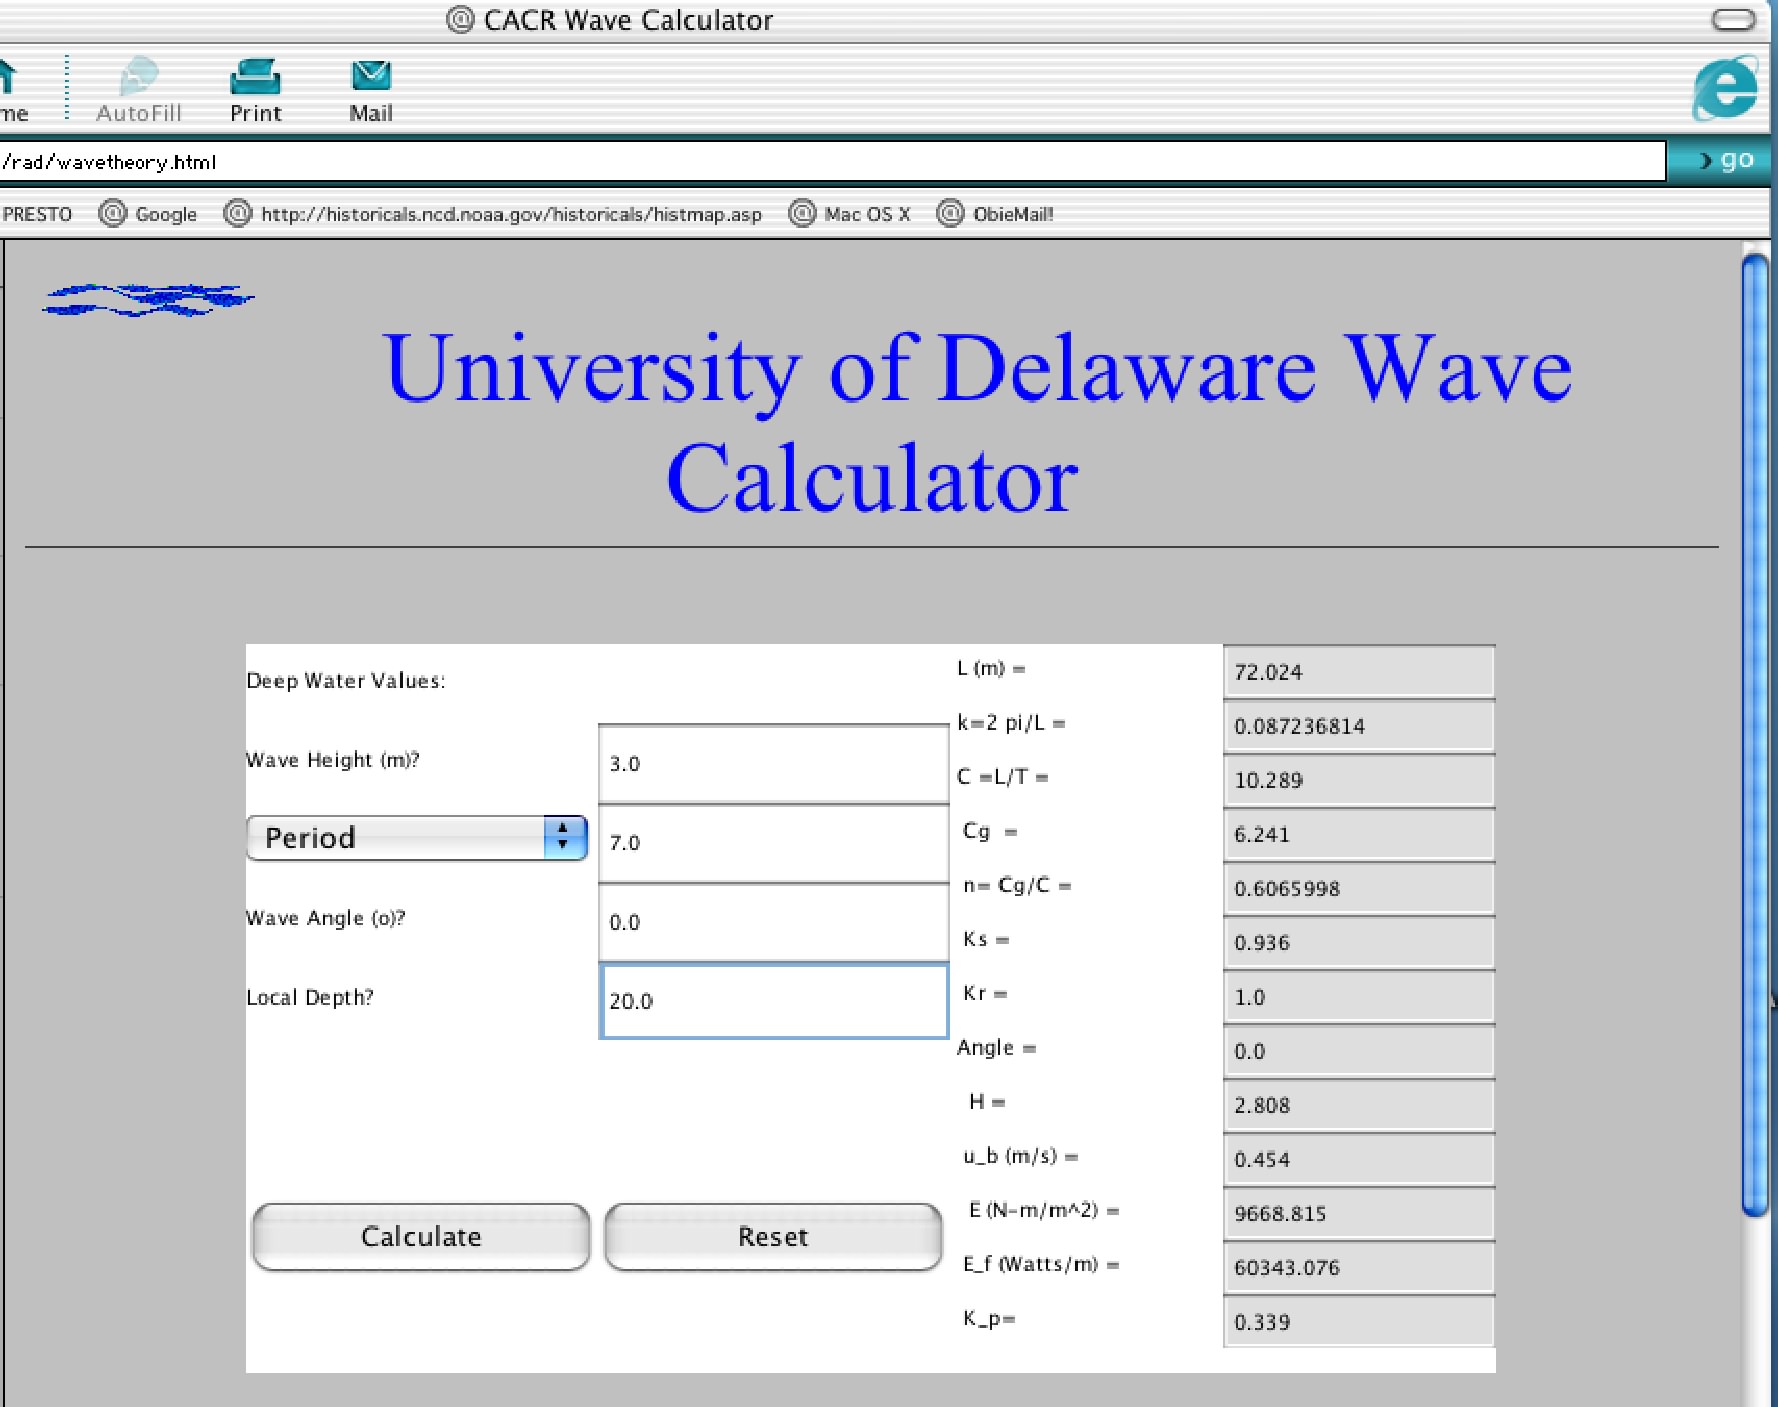
You should get a page that looks like the picture below. If the Calculate button is not there, insert the cursor into the URL window at the top of your browswer and hit return. The page should come up OK then (there is some sort of intermittent fluke in the web page, but this seems to be a usable work-around).
You will be asked to fill in information about your wave as it appears in deep water (i.e., before it "feels bottom"). For Wave Height (this is the height of the wave in deep water, i.e., before it "feels bottom" on its way to shore), use 3m, and then 2 m. For Wave Period, use 7 seconds throughout. Leave Wave Angle at 0.
Starting at 100 meters, the program will calculate the parameters on the right once you hit the Calculate button (note: hitting Return will do nothing). You will repeat this at depths of 80, 60, 50, 40, 30, 20, 10, 8, 6, 4, 2 and 1 meters. Simply type these numbers into the window for Local Depth and click on Calculate. The program will compute a number of parameters for the wave at that depth and will list them in the gray boxes at the right.
Copy the information for the following parameters into the Wave Ex Spreadsheet that I have placed on eres for you:
Wavelength (L): this is the distance between wave crests.
Wave Celerity (C): this is the forward speed of the wave crest.
Wave height (H): This is the vertical distance between the wave crest and trough at the water depth you types into the "local height" window.Note: once the wave breaks (indicated by "breaking" in the Height window), your calculations are done for that wave.
Wave Energy-1 (N-m/m2): This is the average amount of energy per square meter of surface area between two wave crests. Think of this as a measure of the CONCENTRATION OF ENERGY in the wave.
Wave Period (T): This is the time it takes one wavelength to pass a given spot. I've set up a calculation algorithm in the spreadsheet for you, so it should be automatic. If it gets corrupted, remember that it is L/C.
Once you have filled in the spreadsheets, use excel to create graphs for each perameter (on the y-axis) versus depth (on the x-axis). Note: you may not have to graph all the results for the second heigh - if you can see the changes in the numbers from deep-water height.
QUESTIONS:
Now, answer the following questions:
1. How do wavelength (L) and wave speed (C) change as the wave approaches the beach?
2. What is causing the change in wave speed?
3. How is this related to the change in wavelength you noted?
4. What is happening to wave period (don't worry about any changes less that .001 seconds; they can't be measured)?
5. At what point does wave height change? How does this relate to when wave speed changes?
6. What's happening?
7. Describe what generally happens to wave height as it approaches the beach. What is causing this pattern?
8. How does this pattern change as you get very close to the beach?
9. What is odd about this (other than its different from what you saw up to this point)?
10. The $64,000 question: Why does wave height suddenly increase close to the beach even though you should be losing wave energy to bottom friction? You may not get this one. If not, don't worry, but still give it your best shot.
You will HAND IN the graphs and your answers on Monday after the discussion.