Citywide Environmental Dashboard 21 March 2013
In a groundbreaking collaboration between Oberlin College and the city of Oberlin, students and faculty have launched the Bioregional Dashboard, a user friendly way to provide feedback on energy and water usage across the community—and ultimately to foster more environmentally engaged citizens.
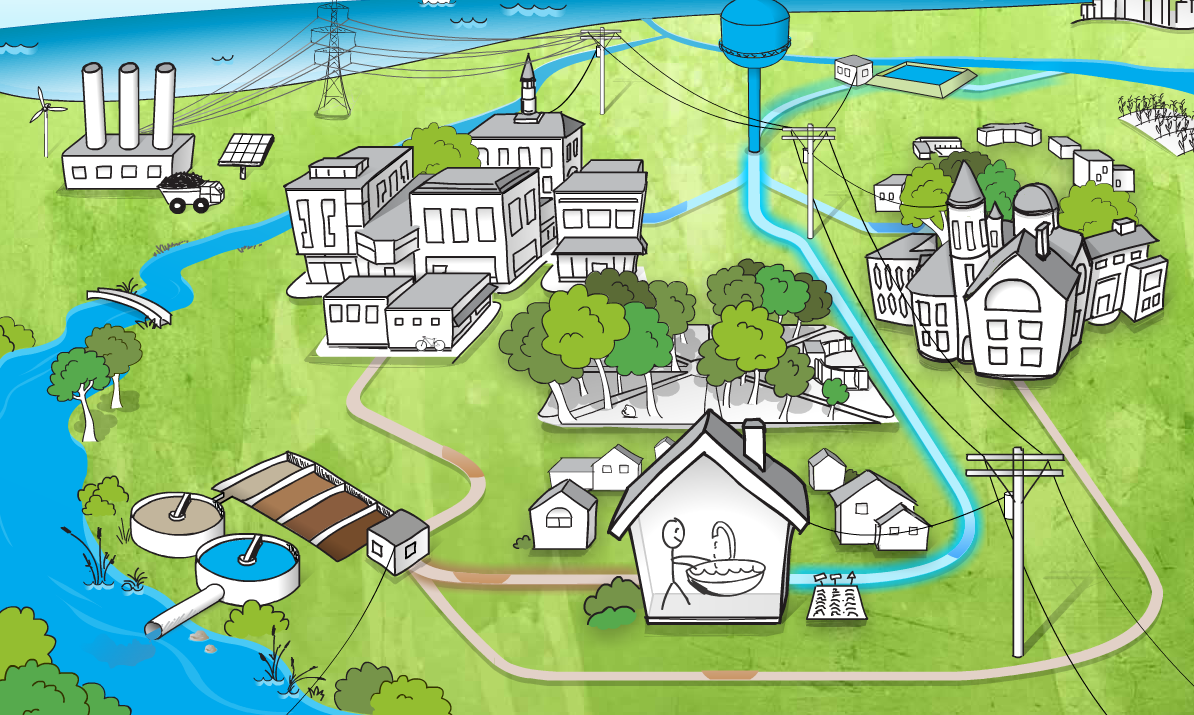
There are three core components of the Environmental Dashboard. First, Building Dashboards measure electricity and water consumption in individual buildings—schools, businesses, public facilities, and homes—and translate this into animated web-based displays. Second, the Bioregional Dashboard is an animated real-time display of current electricity and water use and environmental conditions though the entire community, narrated by cartoon characters. Finally, Community Voices combines photographs, artwork, thoughts, ideas, and actions of community members and groups to celebrate and encourage positive action.