Manual
Part A.2 Using the Graphical User Interface (nrngui)
This simulation starts with the soma that was created in the previous tutorial (Soma.hoc). Open this file and save it under a different name (SomaGUI.hoc) in the same directory. We will now be working with this new file.
To ease the process of running simulations, has a standard run library of useful functions. There are many ways to load the standard run library. Probably the most convenient is to add the following to the beginning of your SomaGUI.hoc file:
load_file("nrngui.hoc") - place this on the first line of the program. In the sample code it is on line 8 because line 8 is actually the first line of code. Line 1-7 are comments.
After adding the line above, please run this file (see section A.1 on how to run a .hoc file). After running the file you should end up with the display shown at the end of tutorial A.1, the terminal window, as well as another window called Main Menu. If this second window doesn't show up, it may be behind the terminal window that shows the results of running the program.

A.2.a. The Main Menu
As mentioned before, the load_file("nrngui.hoc") ensures that we have a " Main Menu" window on the screen:
The Main Menu toolbar, can be used to pop up graphical tools for controlling, displaying, and analysing model parameters and simulation results. The window contains menus File, Edit, Build, Tools, Graph, Vector and Window. We will first explore the tool for Running a simulation and then look at the tool for graphing the values.
A.2.b. GUI Run Control (Tools>>RunControl)
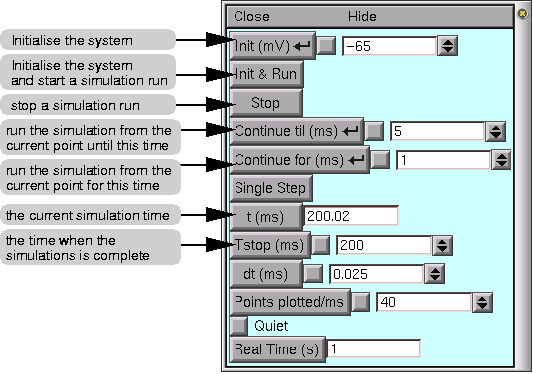
Under the Tools menu select RunControl. This generates a window that allows you to view and control primary parameters for running the simulation. These parameters include tstop that is already part of our program (SomaGUI.hoc). Note that the tstop value in the RunControl window reflects the value set in our program i.e. 300 ms. The graphic below describes the various buttons found in the RunControl Window.

The RunControl window, as with many other windows you will encounter, has a common format. There are buttons, such as "Init & Run" which will run the simulation, and field editors next to some buttons (e.g. next to our tstop variable button there is a text box). Whenever you see this type of box, you can enter a new value by simply placing the mouse pointer into the field editor, clicking the left mouse button, and typing. A vertical bar should appear in the field editor, indicating the point where what you type will be seen. After you have entered the new number (or expression), you need to tell to accept the number (or expression) you just entered. You can do this either by pressing the Enter key on your keyboard, or by clicking on any button in the RunControl panel. Some labelled buttons have a smaller, unlabelled square button just to their right. This is a check box, and a red check mark will appear in it if the value in the adjacent field editor has been changed from its default. Thus, if you change the value of tstop, a check mark will appear in the check box signifying that you have changed the value of this field editor. In addition, by pressing the check box, you can toggle between the default value and the changed value.
A.2.c. Running and changing parameters from either the GUI or the command line
The command line window (terminal window) and the RunControl GUI window you just opened are linked. To prove this, in the command line window type the lines below and watch the values in the RunControl Window. Hit the enter/return key after each line. Be sure you can see both windows before proceeding.
You should see the following (you need to type the maroon, italicized text):
oc>print tstop
300
oc>tstop = 100
oc>print tstop
100
oc>psection()
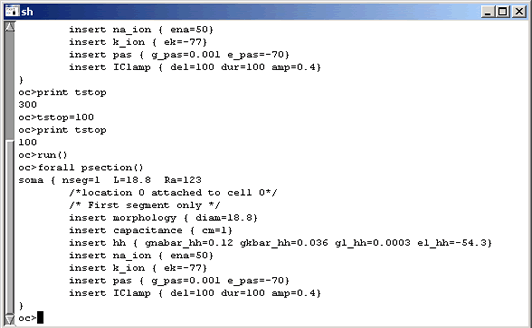
You should see the following in the terminal window:

In addition, the text in the RunControl>>Tstop (ms) variable text box should have changed to 100 and a red checkmark should appear in the check box between the button and the text box.
Toggle back to the default Tstop time by unchecking the check box with the red check.
Then click on the button to run the simulation again. The value in the t(ms) box should increment. Other then that nothing should change in either window.
Now type
oc> print tstop
What happens? It should display 300, or whatever number follows "tstop =" in your code.
A.2.d. Graphing changes in voltage over time
In addition to controlling the simulation we will want to observe the voltage changes in the soma over the period of simulation (300ms in our current example). Currently all we can see is the final voltage in the soma by typing print soma.v at the terminal oc> prompt.
To get a better view of what is happening to the voltage at specific timepoints it would make sense to graph the changes. Under the Graph menu of the main window, select Voltage axis. This generates another window that will display voltage on the y-axis and time on the x-axis. In the current example the soma is the default section, so the soma voltage will be plotted by default.
When there is more than one section (e.g. when we have added dendrites - outlined in the next section) then we must specify which section to plot. You can open as many voltage or other graph windows as you like adjusting what section is graphed in each.
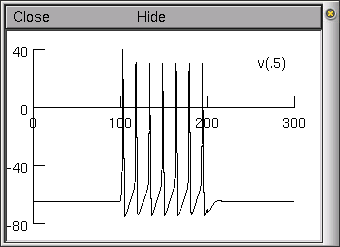
Now, run the simulation by clicking on the Init & Run button in the RunControl window or by typing oc>run() in the terminal window. Observe the voltage being graphed. You should end up with a voltage graph similar to that illustrated to the below.

A.2.e. Visualizing the result of changes to different mechanisms
The most obvious change would come from adjusting the amount of current that is passed through the electrode. In the Soma.hoc file the properties of the electrode point process were as follows:
objectvar electrode
electrode = new IClamp(0.5)
electrode.del = 100
electrode.dur = 100
electrode.amp = 0.45
In some versions of NEURON, the X in the top-right portion of the windows aren't functional. If this is the case, close the RunControl window by clicking on the Close text in the upper left portion of the window.
Using the command line in the terminal window to make changes
to the electrode properties
With the Graph of voltage still open, type the following into the terminal window:
oc> electrode.amp=.2
oc>run()
You should only see a single spike in the voltage graph. Now change the amplitude to .8 and see what happens.
Using a GUI to change the electrode properties
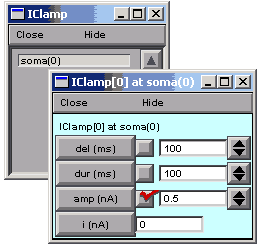
In the Main Menu window select Tools>>PointProcesses>>Viewers>>PointProcesses>>IClamp. A window with a list of IClamp point processes associated with this model will appear. Double click on the soma(.5) point process. This is the point process we called "electrode" in the Soma.hoc file.

The amplitude of this particular point process (IClamp - electrode) can be changed from the command line of the terminal window, as we did above, or the IClamp[0] at soma() window pictured to the left.
Why is the check box between the amp(nA) button and the textbox checked?
Now uncheck the check box. The value in the textbox will revert to the original value, 0.45. To make sure the terminal window is "seeing" the results of this change, type oc>print electrode.amp
More of the GUI functionality will be explained in future tutorials.
Try to run the program either from the terminal window or the RunControl GUI. Change various parameters and make sure the graph reflects the appropriate results.
SUMMARY:
- The Main Menu Window
- The Tools>>RunControl window
- Running and changing parameters from either the GUI or Command line(Init & Run)
- Graphing the results of the current injection on the cell's membrane voltage
- Change parameters of point process (electrode) using the graphical user interface (GUI)
Next: Creating Dendritic processes
Acknowledgements
Last modified on 10/29/04 by
Albert Borroni, CS/Neuoriscience Oberlin College (aborroni@oberlin.edu)
based on tutorial written by
Andrew Gillies (andrew@anc.ed.ac.uk)
David Sterratt (dcs@anc.ed.ac.uk)
which is originally based on the tutorials by Kevin E. Martin
with the assistance of Ted Carnevale and Michael Hines